
Microbial ecology study – real-time polymerase chain reaction (PCR)
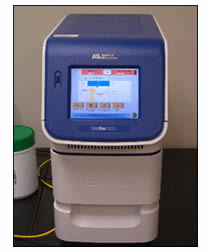
The StepOne™ Real-Time PCR System is a 48-well Real-Time PCR instrument with simple and flexible instrument set-up and usage. It is designed to deliver precise, quantitative Real-Time PCR results for a variety of genomic research applications.
In our previous studies, the StepOne™ Real-Time PCR System was mainly used to quantify the bacteria involved in nitrogen cycle such as ammonia-oxidizing bacteria (AOB), nitrite-oxidizing bacteria (NOB) and denitrifiers by amplifying their amoA, NSR and nirK genes respectively. DNA from the soil/media sample was extracted by using a SoilMaster® DNA Extraction Kit (EPICENTRE). The extracted DNA was finally resuspended in 300 uL TE Buffer. Real-time PCR quantification was performed to amplify the target genes, which are in direct proportion of the number of bacteria.
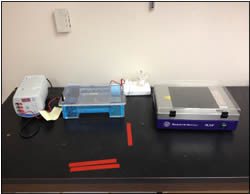
DNA Gel electrophoresis is a method to sort molecules based on their size and charge. It is performed after amplification of DNA via PCR and further used as a preparative technique prior to use of cloning and qPCR. Shorter molecules move faster than longer ones within the agarose gel. DNA can be visualized with ethidium bromide (EB) under ultraviolet light.
Ecotoxicity testing – Algal toxin
Cyanobacteria and the hepatotoxic microcystins were present in 15 central Florida, USA, stormwater ponds where all had detectable levels of microcystin with concentrations ranging from 0.04 to 1.6 μg/L. Cyanobacteria may proliferate in stormwater ponds; cyanotoxins produced by these organisms represent potential public health concerns. Microcystins and Cylindrospermopsin have been found in fresh water throughout the world. Acute poisoning of humans and animals constitutes the most obvious problem from toxic cyanobacterial blooms, and in several cases has lead to death. These toxins mediate their toxicity by inhibiting liver function. The WHO has proposed a provisional upper limit for microcystin-LR of 1.0 ppb (ug/L) in drinking water and a tolerable daily intake (TDI) of cylindrospermopsin as 0.02 g/Kg body weight/day.
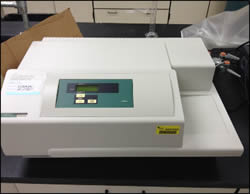
Algal toxin was quantitatively analysed using commercially available ELISA kits (Microcystin-ADDA and Cylindrospermopsin kits, Abraxis, LLC, Warminster, PA). The detection limit for each ELISA is 0.1 μg/L (MCLR) and 0.04 μg/L (CYL).
Lake, streams, and wetland restoration Best Management Practices (BMP)
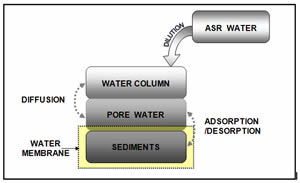
The excess ions such as calcium, iron, sulfate, etc. into the lake have the potential to impact the biological and chemical environment of the lake water. Our study is to explore the interactions between the water column, pore water and the bottom sediment, which compounds the biogeochemical cycle due to the dynamics of phosphorus concentrations in terms of adsorption, desorption, and diffusion processes. This research presented a systematic assessment based on explored the sensitivity with respect to the chemical equilibrium between lake water and lake sediment.
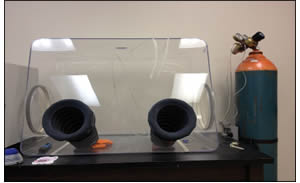
Glove Box
A glove box is a sealed container that allows one to manipulate items where a very high purity inert atmosphere is desired. It is also possible to use a glovebox for manipulation of objects in a vacuum chamber. In our previous study, the glove box was used to provide an anaerobic condition for the measurement of Oxido-reduction Potential (ORP) by filling the glove box with nitrogen gas.
FT-ICR MS analysis collaborated with the National High Magnetic Field Laboratory (NHMFL) in Tallahassee, FL
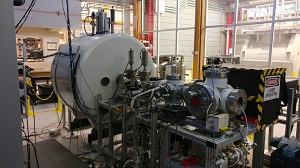
- Instrumentation: 9.4 T FT-ICR MS. DOM extracts were analyzed with a custom-built FT-ICR mass spectrometer2 equipped with a 9.4 T horizontal 220 mm bore diameter superconducting solenoid magnet operated at room temperature, and a modular ICR data station (Predator)3 facilitated instrument control, data acquisition, and data analysis. Ions generated at atmospheric pressure were accumulated in an external linear quadrupole ion trap for 300-700 ms and transferred by rf-only quadrupoles (2.0 MHz and 255 Vp-p amplitude) to the ICR cell.4 ICR time-domain transients were collected from a 7 segment open cylindrical cell with capacitively coupled excitation electrodes5 based on the Tolmachev configuration.6, 7 100 individual transients of 5.8-6.1 s duration collected for crude extracts were averaged, apodized with a Hanning weight function, and zero-filled once prior to fast Fourier transformation. For all mass spectra, the achieved spectral resolving power approached the theoretical limit over the entire mass range, e.g., average resolving power, m/∆m50%, in which ∆m50% is mass spectral peak full width at half-maximum peak height was ~1,000,000-1,300,000 for absorption mode at m/z 500 for all mass spectra.
- Instrumentation: ESI Source. Sample solution was infused via a microelectrospray source1 (50 µm i.d. fused silica emitter) at 400 nL/min by a syringe pump. Typical conditions for negative ion formation were: emitter voltage, -2.5-2.8 kV; tube lens, –250 V; and heated metal capillary current, 7 A.
- Sample preparation. All solvents were HPLC grade (Sigma-Aldrich Chemical Co., St. Louis, MO) and SPE extracts were diluted 1:2 in methanol prior to negative ion electrospray ionization.
- Instrumentation: Broadband Phase Correction. Due to increased complexity at higher m/z, broadband phase correction8, 9 was applied to the entire mass spectrum for the Macondo well petroleum to increase resolution of isobaric species as previously described.10 Briefly, Fourier transformation of a discrete time-domain data set yields real and imaginary frequency-domain spectra, Re(ω) and Im(ω), that are linear combinations of absorption- and dispersion-mode components, A(ω) and D(ω). Therefore FT-ICR spectra are conventionally displayed in magnitude (absolute-value) mode, M(ω) = [[Re(ω)]2 + [Im(ω)]2]1/2. As described in detail elsewhere,8, 9 it is possible to determine the phase angle, φ = tan-1[Im(ω)/Re(ω)], for each peak, and then construct the appropriate linear combination of real and imaginary FT spectra to recover the absorption-mode display. Absorption-mode spectral resolving power is higher by a factor of up to 2 than magnitude-mode resolving power. Frequency-to-m/z calibration and data analysis are subsequently performed as for magnitude-mode display.
- Mass Calibration and Data Analysis. ICR frequencies were converted to ion masses based on the quadrupolar trapping potential approximation.11, 12 Each m/z spectrum was internally calibrated with respect to an abundant homologous alkylation series whose members differ in mass by integer multiples of 14.01565 Da (mass of a CH2 unit) confirmed by isotopic fine structure based on the “walking” calibration equation.13 Experimentally measured masses were converted from the International Union of Pure and Applied Chemistry (IUPAC) mass scale to the Kendrick mass scale14 to identify homologous series for each heteroatom class (i.e., species with the same CcHhNnOoSs content, differing only by their degree of alkylation). Peak assignments were performed by Kendrick mass defect analysis as previously described.15, 16 Peak assignments and data visualization were performed with PetroOrg software.17 For each elemental composition, CcHhNnOoSs, the heteroatom class, type (double bond equivalents, DBE = number of rings plus double bonds involving carbon) and carbon number, c, were tabulated for subsequent generation of heteroatom class relative abundance distributions and graphical abundance-weighted DBE vs. carbon number or H:C ratio vs. carbon number images or van Krevelen diagrams.
References
1. Emmett, M. R.; White, F. M.; Hendrickson, C. L.; Shi, S. D.-H.; Marshall, A. G., Application of micro-electrospray liquid chromatography techniques to FT-ICR MS to enable high-sensitivity biological analysis. J. Am. Soc. Mass Spectrom. 1998, 9, (4), 333-340.
2. Kaiser, N. K.; Quinn, J. P.; Blakney, G. T.; Hendrickson, C. L.; Marshall, A. G., A Novel 9.4 Tesla FTICR Mass Spectrometer with Improved Sensitivity, Mass Resolution, and Mass Range. J. Am. Soc. Mass Spectrom. 2011, 22, (8), 1343-1351.
3. Blakney, G. T.; Hendrickson, C. L.; Marshall, A. G., Predator data station: A fast data acquisition system for advanced FT-ICR MS experiments. Int. J. Mass Spectrom. 2011, 306, (2-3), 246-252.
4. Kaiser, N. K.; Savory, J. J.; Hendrickson, C. L., Controlled ion ejection from an external trap for extended m/z range in FT-ICR mass spectrometry. J. Am. Soc. Mass Spectrom. 2014, 25, 943-949.
5. Kaiser, N. K.; Savory, J. J.; McKenna, A. M.; Quinn, J. P.; Hendrickson, C. L.; Marshall, A. G., Electrically compensated Fourier transform ion cyclotron resonance cell for complex mixture mass analysis. Anal. Chem. 2011, 83, (17), 6907-6910.
6. Tolmachev, A. V.; Robinson, E. W.; Wu, S.; Kang, H.; Lourette, N. M.; Pasa-Tolic, L.; Smith, R. D., Trapped-Ion Cell with Improved DC Potential Harmonicity for FT-ICR MS. J. Am. Soc. Mass Spectrom. 2008, 19, (4), 586-597.
7. Tolmachev, A. V.; Robinson, E. W.; Wu, S.; Smith, R. D.; Pasa-Tolic, L., Trapping radial electric field optimization in compensated FTICR cells. J Am Soc Mass Spectrom 2011, 22, (8), 1334-1342.
8. Xian, F.; Corilo, Y. E.; Hendrickson, C. L.; Marshall, A. G., Baseline correction of absorption-mode Fourier transform ion cyclotron resonance mass spectra. Int. J. Mass Spectrom. 2012, 325-327, 67-72.
9. Xian, F.; Hendrickson, C. L.; Blakney, G. T.; Beu, S. C.; Marshall, A. G., Automated Broadband Phase Correction of Fourier Transform Ion Cyclotron Resonance Mass Spectra. Anal. Chem. 2010, 82, (21), 8807-8812.
10. Beu, S. C.; Blakney, G. T.; Quinn, J. P.; Hendrickson, C. L.; Marshall, A. G., Broadband phase correction of FT-ICR mass spectra via simultaneous excitation and detection. Anal. Chem. 2004, 76, (19), 5756-5761.
11. Shi, S. D.-H.; Drader, J. J.; Freitas, M. A.; Hendrickson, C. L.; Marshall, A. G., Comparison and interconversion of the two most common frequency-to-mass calibration functions for Fourier transform ion cyclotron resonance mass spectrometry. Int. J. Mass Spectrom. 2000, 195/196, 591-598.
12. Grosshans, P. B.; Shields, P. J.; Marshall, A. G., Comprehensive Theory of the Fourier Transform Ion Cyclotron Resonance Signal for All Ion Trap Geometries. J. Chem. Phys. 1991, 94, 5341-5352.
13. Savory, J. J.; Kaiser, N. K.; McKenna, A. M.; Xian, F.; Blakney, G. T.; Rodgers, R. P.; Hendrickson, C. L.; Marshall, A. G., Parts-Per-Billion Fourier Transform Ion Cyclotron Resonance Mass Measurement Accuracy with a “Walking” Calibration Equation. Anal. Chem. 2011, 83, (5), 1732-1736.
14. Kendrick, E., A Mass Scale Based on CH2 = 14.0000 for High Resolution Mass Spectrometry of Organic Compounds. Anal. Chem. 1963, 35, (13), 2146-2154.
15. Hughey, C. A.; Hendrickson, C. L.; Rodgers, R. P.; Marshall, A. G.; Qian, K., Kendrick Mass Defect Spectroscopy: A Compact Visual Analysis for Ultrahigh-Resolution Broadband Mass Spectra. Anal. Chem. 2001, 73, 4676-4681.
16. Wu, Z.; Rodgers, R. P.; Marshall, A. G., Two and Three Dimensional van Krevelen Diagrams: A Graphical Analysis Complementary to the Kendrick Mass Plot for Sorting Elemental Compositions of Complex Organic Mixtures Based on Ultrahigh-Resolution Broadband FT-ICR Mass Measurements. Anal. Chem. 2004, 76, 2511-2516.
17. Coril, Y. E., PetroOrg Software. Florida State University; All Rights reserved. http://www.petroorg.com.