

Voxler®
Voxler® is a robust program, which can display the data in a variety of formats: 3D volrender, isosurfaces, contours, 3D slices, orthographic and oblique images, scatter plots, stream lines, and vector plots. Voxler® was used to demonstrate the tracer, Rhodamine WT distribution through 3D data visualization in a subsurface upflow wetland.

Time-series profile view of the tracer distribution in wetland via Voxler®
Discipulus®
The principle of Evolutionary Computing (EC) is rooted in Genetic Algorithms (GA), first developed by Holland, and is similar to Evolution Strategies (ES) and Evolutionary Programming (EP) developed by Fogel. All three approaches were eventually combined into one entity called Evolutionary Computation. Under the EC framework, the well-known GP approach was invented by Koza, which became the best advancement to create best-selective nonlinear regression models in terms of selected multiple independent variables. Genetic operations such as reproduction, crossover, and mutation are involved during model development. We used the Discipulus® software package, developed by Francone, to perform the genetic programming (GP) modeling analysis.
Modeler®
The k-means analysis is actually a data mining technique, which is a prototype-based partitioning technique, developed to identify a user-specified number of clusters (K) composed of a transformed dataset of (n) objects represented by their centroids. The user specifies the prescribed number of clusters to be generated in the analyses output with the limitation of K < n. Techniques for selecting these initial seeds include sampling at random from the dataset, setting them as the solution of clustering a small subset of the data, or perturbing the global mean of the data k times. The k-means function is comprised of a two-step iterative process: step 1 assigns each data point to its closest centroid; step 2 relocates the cluster centroid until the distance between the centroid and the data points no longer change. The principle incorporated in the k-means clustering analysis is the Euclidean distance (in mathematics the distance between two points), which can be measured with a measuring device or found using the Pythagorean formula.
IBM SPSS Modeler®, Version 14.1 was used to de the k-means clustering analysis.
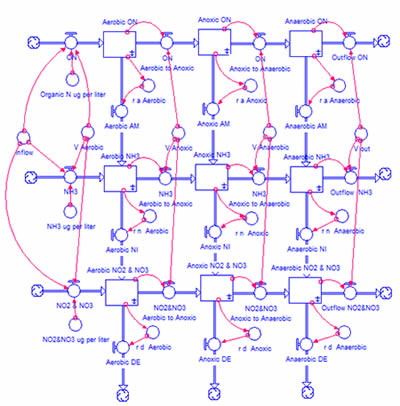
STELLA®
STELLA® is quite accessible graphical programming dynamic simulation software, which shows a very friendly intuitive icon-based graphical interface. As icons of stock and flow are drawn on front canvas layer, model equations are automatically generated on the equation layer beneath. Simulation runs can be carried out entirely along the prescribed timeline. Results can be presented via graphs, tables, animations with the running simulation. STELLA® was used to construct a system dynamics model to explore the nutrient removal mechanism and sensitivity of the innovative underground media filter.
ArcGIS, ERDAS
ArcGIS, ERDAS support geospatial data processing and allows the user to prepare, display and enhance digital images/ maps for geospatial applications.
